Prepared Exclusively for Winter Holdings 11747 LLC
August 2026

The LAAA Team has closed 492 transactions totaling $1.55B across 21 states and Washington, D.C., including 340 apartment sales covering 4,668 units. That record is built on Los Angeles multifamily, and on rent-controlled product in particular.

Our public, continuously maintained reach combines active email subscribers, owner and investor contacts, a building-owner database, and targeted direct buyer calls for each listing.
Most brokers are reactive. They post the listing, run an email blast, and wait for the phone to ring. We do all of that, and we do it well. Then we do the part almost nobody does. We pick up the phone.
Before your building goes to market, our system builds a probable buyer list for it specifically. It pulls the county assessment record for every property in the surrounding area: who owns it, where their mail goes, what they paid, when they bought, who financed it, and how many other buildings they hold. Out of that come the three groups most likely to buy your building. Owners of comparable product nearby. Buyers who have closed on buildings like yours recently. Exchange buyers with money that has to be placed on a deadline.
That list runs well over 100 names, and we call every one of them.
This is a proven system and we built it ourselves. It is not a Marcus & Millichap product and it did not come with the brand. Our team designed it, we own it, and we use it on every listing we take.
Sitting on top of it is the part software cannot buy. Careers spanning 20 years of notes on these same buyers. We have their direct numbers and their emails. We know what they bought last, what they passed on and why, and what they are hunting for now. Every seller we take on inherits all of it on day one.
Then we work it. Buyer lists, offer matrices, and a straight answer every week on who called, who toured, and what they said.
The campaign runs direct outreach to nearby rent-controlled owners, the Marcus & Millichap platform, and a dedicated property website, with the printed and digital material built from the same verified rent roll and comparable set used in this opinion.
11747-53 Moorpark St is two 1948 fourplexes on adjoining Studio City parcels, APN 2364-010-024 and APN 2364-010-023, operated and presented as a single eight-unit asset.
The unit mix is four one-bedroom and four two-bedroom units, twelve bedrooms in total, with every unit carrying a dedicated dining room, a back door and garage access.
The opinion below is built from the current rent roll, an operating expense build-up at the bottom of every benchmark band, and ten deed-verified sales south of the 101, and it separates the rent-controlled evidence from the 1980s product that is not rent controlled.
Two features carry the property against its cohort. The units are larger than most rent-controlled stock in the pocket, and the amenity set is deeper than an eight-unit building normally offers. The campaign should lead with both, and with the delivered vacancy.

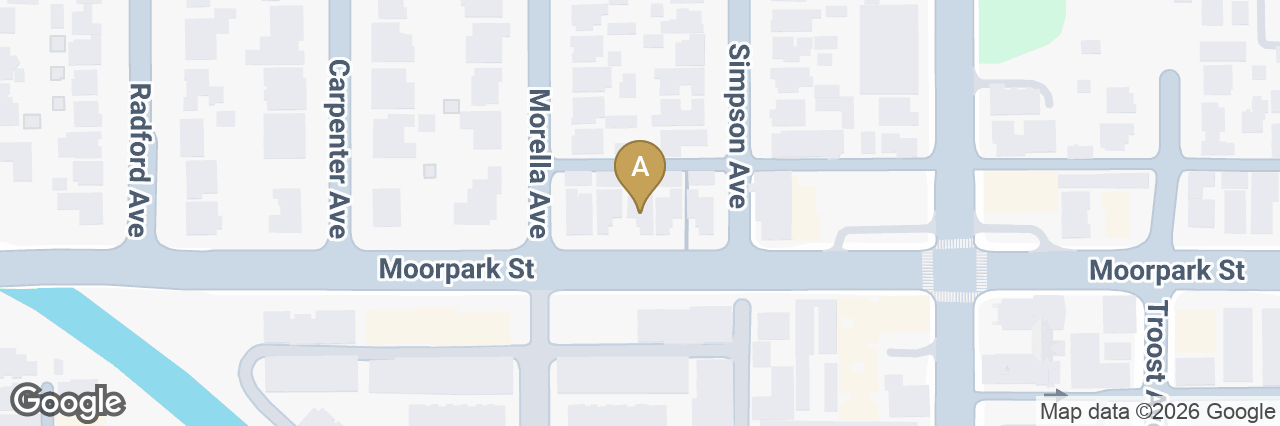
The property sits on Moorpark St in Studio City, south of the 101 freeway, within the pocket bounded by Laurel Canyon, Coldwater Canyon and Ventura Blvd.
The south side of the freeway trades as its own market. Every comparable in this opinion is drawn from that side, because buildings north of the 101 do not price the same way and mixing them would flatter the result.
| Property & Location Details | |
|---|---|
| Address | 11747-53 Moorpark St |
| City | Studio City, CA 91604 |
| APN | 2364-010-024, 2364-010-023 |
| Year Built | 1948 |
| Building SF | 7,496 |
| Lot Size | 12,012 SF (0.276 ac) |
| Units | 8 |
| Parking | Eight garage spaces |

| Property Overview | |
|---|---|
| Units | 8 |
| Year Built | 1948 |
| Building SF | 7,496 |
| Lot SF | 12,012 |
| APN | 2364-010-024, 2364-010-023 |
| Unit Mix | |
|---|---|
| 4x 1BR / 1BA | 800 (est.) SF |
| 4x 2BR / 1BA | 1,050 (est.) SF |
The two 1948 structures hold 3,748 SF each on 6,006 SF parcels, combining to 7,496 SF of building on 12,012 SF of land. Building area and lot size are confirmed by both the county assessor and the MLS record.
Amenities include a pool, eight garage parking spaces and laundry equipment the ownership owns rather than leases. Gas and electric are individually metered and paid by the tenants. Water is master metered and paid by ownership.
Recent capital work covers a new roof, a new pool fence, and electrical that has passed insurance inspection.
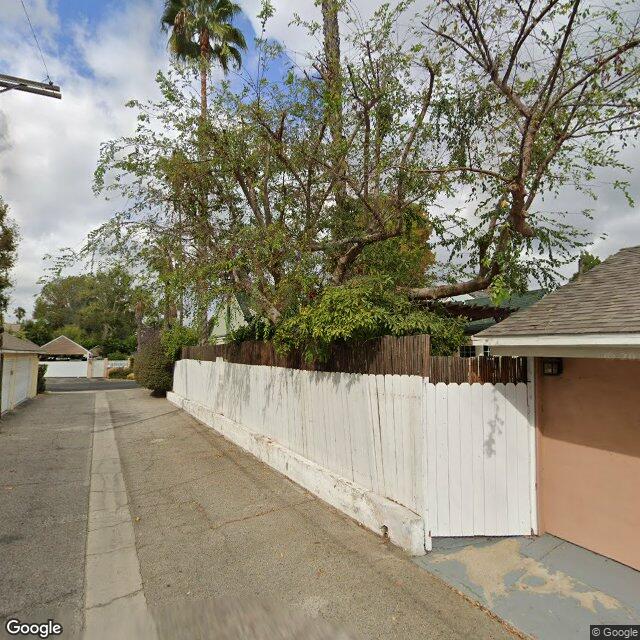
Click any image to enlarge. Images depict the property and representative interiors. Source: listing media and site photography.
The Local Rent-Stabilized Operator
An owner who already operates rent-stabilized buildings in the San Fernando Valley, who reads the regulatory environment as a known cost rather than a risk, and who values the two-parcel structure for its future flexibility.
The 1031 Exchange Buyer
An exchange buyer working against an identification deadline, for whom a stabilized eight-unit asset with completed capital work and one unit delivered vacant is a clean place to land.
Lead With the Unit Size
At 937 SF per unit the building runs larger than most of its cohort, and every unit carries a dedicated dining room and a back door. That is the first thing a buyer notices on tour and it is the hardest thing for a competing building to answer.
Sell the Amenity Set
A pool, eight garage spaces and owned laundry equipment on a 12,012 SF lot is an unusual amenity set at this size. The roof, the pool fence and the electrical work are already complete, so the capital plan is not the buyer's first problem.
Deliver the Vacancy as an Asset
One two-bedroom unit is delivered vacant at close. Under rent stabilization a vacant unit lets the buyer set the rent himself, which is worth more to him than the same unit leased.

| Address | Unit Type | SF | Asking Rent | Distance |
|---|---|---|---|---|
| 11645 Moorpark St | 1BR / 1BA | 798 (est.) | $2,145 | 0.14 mi |
| 11645 Moorpark St | 2BR / 1BA | 1,096 (est.) | $2,495 | 0.14 mi |
| 11434 Moorpark St | 1BR / 1BA | 833 (est.) | $2,322 | 0.52 mi |
| 11434 Moorpark St | 2BR / 2BA | 958 (est.) | $2,570 | 0.52 mi |
| 12251 Moorpark St | 2BR / 2BA | 1,280 (est.) | $3,050 | 0.63 mi |
| 12251 Moorpark St | 2BR / 2BA | - | $2,700 | 0.63 mi |
| 12251 Moorpark St | 2BR / 2BA | - | $2,850 | 0.63 mi |
| Average (7 rent comps) | 993 (incl. est.) | $2,590 | 0.46 mi | |
Market rent evidence for the vacating two-bedroom unit comes from Rentometer across 22 comparables within half a mile, which puts the median at $2,995 and the 25th percentile at $2,809. The one-bedroom median is $2,197.
The vacating two-bedroom is carried at $2,800, which clears the $2,525 highest in-place two-bedroom rent and sits at the conservative 25th percentile of the external evidence. The one-bedroom side needs no adjustment, because the $2,295 highest in-place rent already exceeds the $2,197 median.

| Address | Yr | Units | Bldg SF | Sale Price | $/Unit | $/SF | GRM | Cap | Date |
|---|---|---|---|---|---|---|---|---|---|
| 11607 Acama St | 1971 | 12 | 16,048 | $3,880,000 | $323,333 | $242 | 10.09 | - | 2026-03-31 |
| 13453 Moorpark St | 1956 | 6 | 5,480 | $1,785,500 | $297,583 | $326 | - | - | 2025-12-24 |
| 4300 Tujunga Ave | 1963 | 10 | 8,892 | $2,975,000 | $297,500 | $335 | 13.16 | - | 2026-07-20 |
| 10602 Landale St | 1956 | 7 | 5,808 | $1,936,000 | $276,571 | $333 | 13.21 | - | 2025-12-05 |
| 4345 Ventura Canyon Ave | 1957 | 12 | 9,249 | $2,850,000 | $237,500 | $308 | 10.70 | - | 2026-06-23 |
| 4108 Whitsett Ave | 1986 | 7 | 6,574 | $2,625,000 | $375,000 | $399 | - | - | 2026-01-28 |
| 4248 Whitsett Ave | 1984 | 7 | 6,600 | $2,549,000 | $364,143 | $386 | - | - | 2025-09-10 |
| 4423 Coldwater Canyon Ave | 1984 | 8 | 7,742 | $2,850,000 | $356,250 | $368 | - | - | 2025-02-26 |
| 11755 Moorpark St | 1949 | 4 | 3,844 | $1,750,000 | $437,500 | $455 | - | - | 2025-12-23 |
| Median (9 comps) | 6,600 | $2,625,000 | $323,333 | $335 | 11.93 | - | - | ||
The buyer for this asset is a private Los Angeles multifamily investor who already owns rent-stabilized product and underwrites to in-place income rather than to a repositioning plan.
1. 11607 Acama St - Rent-controlled cohort, weighted on proximity and recency 12 units, built 1971, 16,048 SF City of Los Angeles RSO, the subject's regulatory cohort
2. 13453 Moorpark St - Rent-controlled cohort, weighted on proximity and recency 6 units, built 1956, 5,480 SF City of Los Angeles RSO, the subject's regulatory cohort
3. 4300 Tujunga Ave - Rent-controlled cohort, weighted on proximity and recency 10 units, built 1963, 8,892 SF City of Los Angeles RSO, the subject's regulatory cohort
4. 10602 Landale St - Rent-controlled cohort, weighted on proximity and recency 7 units, built 1956, 5,808 SF City of Los Angeles RSO, the subject's regulatory cohort
5. 4345 Ventura Canyon Ave - Rent-controlled cohort, weighted on proximity and recency 12 units, built 1957, 9,249 SF City of Los Angeles RSO, the subject's regulatory cohort
6. 4108 Whitsett Ave - 1980s non-RSO product, weighted down as a different asset class 7 units, built 1986, 6,574 SF Not rent controlled, a different regulatory product
7. 4248 Whitsett Ave - 1980s non-RSO product, weighted down as a different asset class 7 units, built 1984, 6,600 SF Not rent controlled, a different regulatory product
8. 4423 Coldwater Canyon Ave - 1980s non-RSO product, weighted down as a different asset class 8 units, built 1984, 7,742 SF Not rent controlled, a different regulatory product
9. 11755 Moorpark St - Rent-controlled cohort, weighted on proximity and recency 4 units, built 1949, 3,844 SF City of Los Angeles RSO, the subject's regulatory cohort
| Units | Type | Approx SF | Current Rent | Current Monthly | Market Rent | Market Monthly |
|---|---|---|---|---|---|---|
| 4 | 1BR / 1BA | 800 (est.) | $2,153 | $8,613 | $2,350 | $9,400 |
| 4 | 2BR / 1BA | 1,050 (est.) | $2,396 | $9,585 | $2,800 | $11,200 |
| Total Scheduled Rent | $2,275 | $18,198 | $2,575 | $20,600 | ||
| Additional Income | - | $773 | - | $773 | ||
| Monthly Scheduled Gross Income | - | $18,971 | - | $21,373 | ||
| Current | Market | |
|---|---|---|
| Scheduled Gross Income | $227,655 | $256,478 |
| Vacancy Reserve at 2.9% | ($6,551) | ($7,416) |
| Credit Loss at 0.0% | $0 | $0 |
| Gross Operating Income | $221,104 | $249,062 |
| Operating Expenses | ($80,296) | ($81,449) |
| Net Operating Income | $140,808 | $167,613 |
| Loan Payments | $124,130 | $124,130 |
| Pre-Tax Cash Flow | $264,938 | $291,743 |
| Principal Reduction | $21,400 | $22,680 |
| Total Return Before Taxes | $286,338 | $314,423 |
| Current | Pro Forma | |
|---|---|---|
| Administrative | $1,000 | $1,000 |
| Common Area Electric | $4,275 | $4,275 |
| Contract Services | $2,000 | $2,000 |
| Insurance[1] | $10,460 | $10,460 |
| Management | $8,735 | $8,735 |
| Other | $250 | $250 |
| Pool | $800 | $800 |
| Regulatory | $347 | $347 |
| Repairs Maintenance[4] | $4,800 | $4,800 |
| Taxes | $37,629 | $37,629 |
| Trash | $2,800 | $2,800 |
| Utilities[5] | $7,200 | $7,200 |
| Underwriting Expense Adjustment[6] | $0 | $1,153 |
| Total Operating Expenses | $80,296 | $81,449 |
| Expense Ratio | 36.3% | 32.7% |
| Per Unit | $10,037 | $10,181 |
| Per Square Foot | $10.71 | $10.87 |
[1] Insurance: The $9,096 LAAA formula plus a 15% pre-1950 adjustment.
[4] Repairs and maintenance: $600 per unit, the bottom of the benchmark band.
[5] Water and sewer: Master metered and owner paid. Gas and electric are individually metered and tenant paid.
[6] Underwriting Expense Adjustment: Aggregate difference between classified T12 expense lines and the modeled current and pro forma operating expense totals.
Owner-reported figures are unaudited. A buyer should verify all income and expenses in due diligence.
| Operating Data | |
|---|---|
| Price | $2,925,000 |
| Number of Units | 8 |
| Price per Unit | $365,625 |
| Price per SF | $390.21 |
| Current GRM | 13.39 |
| Market GRM | 11.83 |
| Current Cap Rate (LAAA calculation: current NOI / recommended value) | 4.81% |
| Market Cap Rate (LAAA-calculated from the approved current NOI and the list price. INTERNAL: withheld from client-facing copy pending Glen's direct approval at package sign-off, per the standing unconfirmed-caps gate.) | 5.73% |
| Proposed Financing | |
|---|---|
| Loan Amount | $1,755,000 |
| Down Payment | $1,170,000 |
| Interest Rate | 0.06% |
| Amortization | 30 years |
| DCR | 1.25 |
Current gross scheduled rent is $218,377 with the vacating two-bedroom carried at its market rent, other income is $9,278 with garages counted as collected today, and operating expenses total $80,296 against effective gross income of $221,104, an expense ratio of 36.3%.
The recommended list price is $2,925,000, or $365,625 per unit and $390.21 per SF, at a 13.39 gross rent multiplier. The expected sale is $2,750,000 and the supported range is $2,650,000 to $2,850,000.
At the list price that is a 4.81% capitalization rate, calculated by LAAA from the current net operating income of $140,808 and the recommended value. It is not a figure taken from any listing or marketing source.
The expected range sits inside the rent-controlled gross rent multiplier band of 10.09 to 13.21 at every rung. On price per unit and price per SF every rung sits above that cohort, and the larger units, the pool, the eight garages and the completed capital work are what carry that difference.
Once all eight units reach the market rents supported by the comparable evidence, gross scheduled rent reaches $247,200 and the gross rent multiplier at the list price falls to 11.83. That is a projection of future income, not current operations.
Supported value range: $2,650,000 to $2,925,000
Operating expenses are underwritten from LAAA benchmarks rather than from a seller operating statement, with property taxes reassessed at the sale price. Reserves are excluded from the figures above.
Water and sewer is carried at a benchmark estimate, and laundry income at an estimate. Twelve months of utility billing and actual laundry collections would replace both.